
How are Stellar Spectra Produced and Measured and it’s General Characteristics

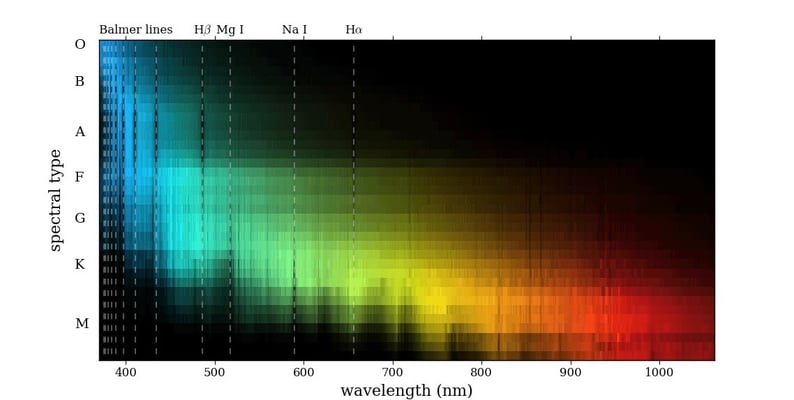
Spectra for dwarfs (luminosity class V) for standard spectral types taken from Pickles (1998). Each row corresponds to one spectrum and the intensity to the brightness at that wavelength, ranging mostly over the optical.
All the information that we are required about a star including its chemistry, mass, temperature, the density, and the luminosity comes more or less directly from studies of their spectra. For this, the light of a star is dispersed into a spectrum by means of a prism or a diffraction grating where the spectra consist of a continuous spectrum or continuum with narrow spectral lines superimposed.
How are stellar spectra produced?
Spectral lines are produced by transitions of electrons within atoms or ions and the lines are mostly dark absorption lines but in some objects, bright emission lines also occur. As the electrons move closer to or farther from the nucleus of an atom (or of an ion), energy in the form of light (or other radiation) is emitted or absorbed.
Related: Stellar Magnitude
Different activity produces different spectral lines; the yellow D lines of sodium or the H and K lines of ionized calcium (seen as dark absorption lines) are produced by discrete quantum jumps from the lowest energy levels (ground states) of these atoms whereas the visible hydrogen lines, so-called the Balmer series, are produced by electron transitions within atoms in the second energy level (or first excited state), which lies well above the ground level in energy.
The general characteristics of the spectra of stars depend more on temperature variations among the stars; red dwarf stars have a low surface temperature so few electrons populate the second level of hydrogen, and thus the hydrogen lines are dim whereas the blue giant star has a very high temperature so the hydrogen atoms are nearly all ionized and therefore cannot absorb or emit any line radiation and consequently, only faint dark hydrogen lines are observed.
The spectra of stars are classified on the basis of the strengths of the spectral lines. Isaac Newton observed the solar spectrum in 1666, but, properly speaking, spectroscopy began in 1814 when Joseph Fraunhofer observed the dark lines in the spectrum of the Sun. He assigned capital letters, like D, G, H and K, to some of the stronger dark lines without knowing the elements responsible for the origin of the lines (Sect. 9.2). The absorption lines are also known as Fraunhofer lines. In 1860, Gustav Robert Kirchhoff and Robert Bunsen identified the lines as the characteristic lines produced by various elements in an incandescent gas.
How are stellar spectra measured?
The most important methods of forming a spectrum are by means of an objective prism or a slit spectrograph. In the former case, one obtains a photograph, where each stellar image has been spread into a spectrum. Up to several hundred spectra can be photographed on a single plate and used for spectral classification. The amount of detail that can be seen in a spectrum depends on its dispersion, the range of wavelengths per millimetre on the plate (or per pixel on a CCD). The dispersion of an objective prism is a few tens of nanometres per millimetre. More detailed observations require a slit spectrograph, which can reach a dispersion of 1–0.01 nm/mm. The detailed shape of individual spectral lines can then be studied.
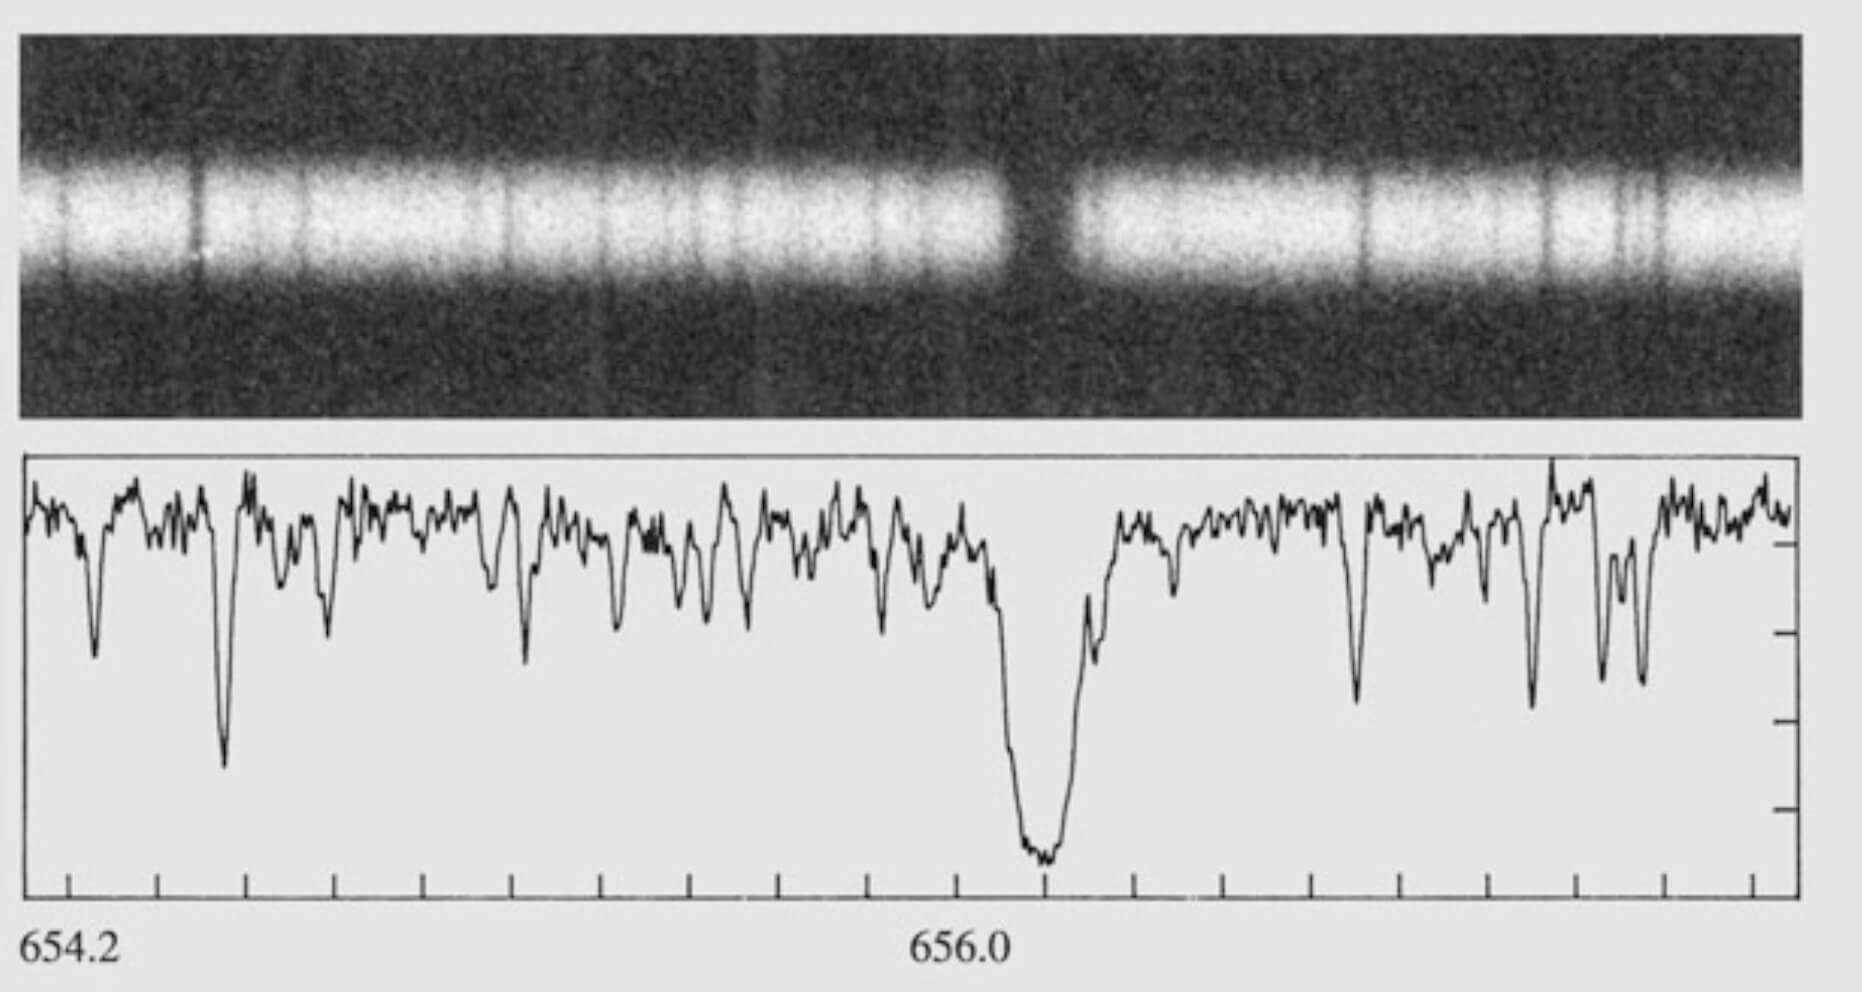
The photograph of the spectrum then is converted to an intensity tracing showing the flux density as a function of wavelength by means of a microdensitometer, measuring the amount of light transmitted by the recorded spectrum. Since the blackening of a photographic plate is not linearly related to the amount of energy it has received, the measured blackening has to be calibrated by comparison with known exposures.
Nowadays CCD cameras are used also in spectrographs and the intensity curve is determined directly without the intervening step of a photographic plate. Some image processing is still needed since the height of the spectrum is several pixels and the spectrum may not be aligned with the pixel rows of the camera.
For measurements of line strengths, the spectrum is usually rectified by dividing by the continuum intensity.
General characteristics of the spectra of stars
The general characteristics of the spectra of stars depend primarily on the temperature variations among the stars and secondarily on varied aspects like the density of the absorbing atmospheric matter, and density, in turn, is related to a star’s surface gravity. Dwarf stars, for instance, have great surface gravities so they tend to have high atmospheric densities and exhibit greater pressure broadening of spectral lines.
Normally, an undisturbed atom radiates a very narrow line and if the energy levels are perturbed by charged particles passing nearby, it radiates at a wavelength near its characteristic wavelength. In a hot gas, the range of disturbance of the hydrogen lines is very high, so that the spectral line radiated by the whole mass of gas is spread out considerably; the amount of blurring depends on the density of the gas in a known fashion. Dwarf stars such as Sirius show broad hydrogen features with extensive “wings” where the line fades slowly out into the background, while supergiant stars, with less-dense atmospheres, display relatively narrow hydrogen lines.