
Rotation Curve Method for Determining the Mass of Spiral Galaxies

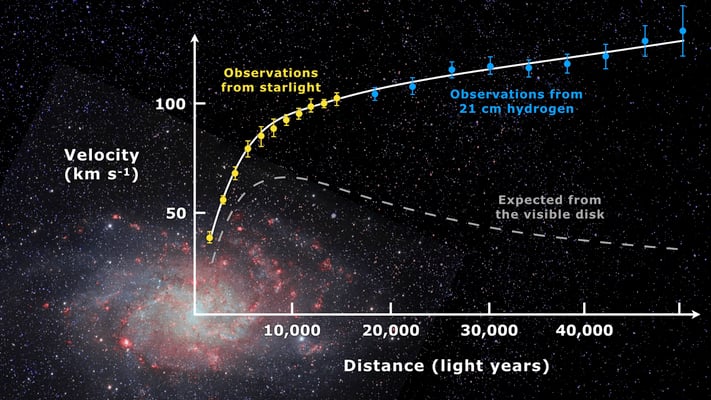
Rotation curve of spiral galaxy Messier 33 (yellow and blue points with error bars), and a predicted one from distribution of the visible matter (grey line).
Despite having methods like velocity dispersion method and average mass method for cluster members by application of the Virial theorem, determining the mass of the galaxies is highly a challenging task. Though we have different methods, depending upon categories, for determining the mass of different galaxies, astronomers are always in quest of the best and best method that gives us higher precisional calculation. Here, I will be highlighting a well-founded method for determining the mass of spiral galaxies; rotation curve method.
The most reliable method for the determination of the mass of a spiral galaxy- rotation curve method, consists in determining the rotation curve of the galaxy and then deriving a density distribution model.
Also Read: What Process Creates and Maintains the Spiral Arms Around Spiral Galaxies?
This method best fits those spiral galaxies that are not too far from us and is bright enough to yield good spectra at several points at different radial distances from the centre.
Under this method, we need to calculate the rotational velocities which are derived from by using the principle of Doppler shift and the tilt of spectral lines originating at different radial distances from the centre of the galaxy under consideration where in most cases the observed spectral lines are usually the emission lines of H, [N II], [S II], [O I], [O II] etc. For instance, in the case of our own galaxy and the nearest spiral galaxy, M31, the rotation curves are constructed from 21-cm hydrogen line observation.
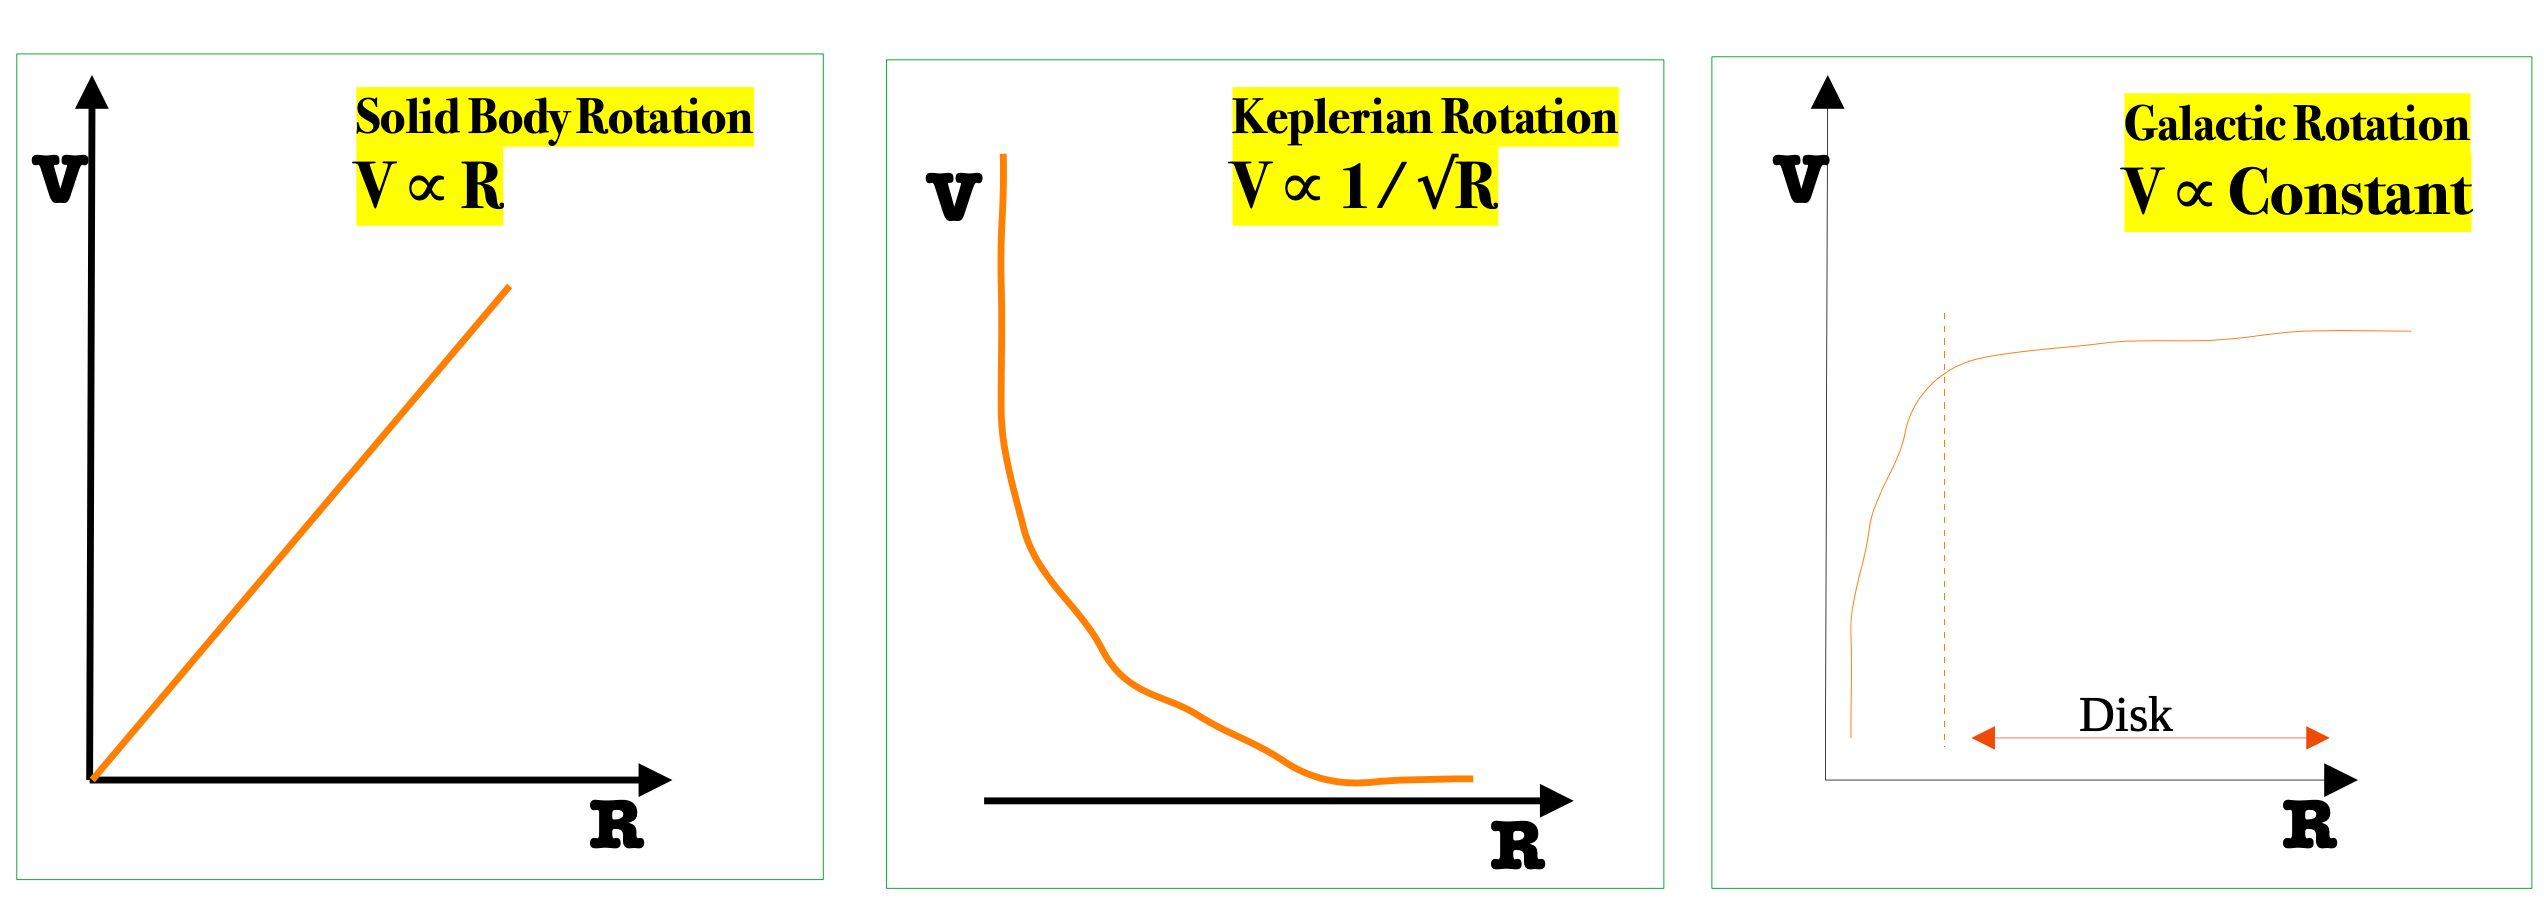
A rotation curve in astronomy is a plot between orbital velocity and its distance from the centre of the object. This curve takes into account of the variation of orbital velocity (V) with the distance from the centre of the object (R) and shows us how the mass is distributed in the solar system (Keplerian Rotation curves) and galaxies (galactic rotation curves), especially spiral galaxies.
From the galactic rotation curve, we can calculate the mass inside a give distance from the centre by using the relation (orbital speed)2 × (distance from the centre)/G where the orbital speed is found from the doppler shifts of the 21-cm line radiation from the atomic hydrogen gas.
Mathematically, further,
The gravitational force is equal to the centrifugal force i.e.
Hence,
Where 𝒗 is the rotation velocity, G is Newton’s gravitational constant, and M the mass inside a particular radius R.
Although this method is best for spiral galaxies, it does not give the best result for galaxies at a far distance and this is mainly for two reasons. One of the reason is due to the weak 21-cm radiation from the distant galaxies and another is the uncertainties in the position measurement due to the poor resolution of the radio telescopes.
But astronomers searched for the solution; they used to record the optical emission lines for such faraway galaxies. Thus except for the nearest galaxies, the optical emission lines are used to construct rotation curves of galaxies. The rotation curve is then converted to a model of mass distribution which integrated over the entire dimension of the galaxy, yields its total mass.